Please zoom into the figures by clicking on each image.
Figure 4.2: Channel-story networks

As seen above, the channels that produced the most material are also the most social — The Plate blogs, Twitter and Instagram. Though the channels at bottom right seem simple and small by comparison, this does not represent their depth or the time required to produce their stories. On the contrary, some of the smaller and more tightly contained networks, such as the museum exhibit, may be the largest and most expensive. What is represented by these graphs are possible connection points with other networks, increasing the visibility and influence of a story. The museum exhibit, for example, is only available at a specific brick-and-mortar location for a limited time and cannot be experienced by secondary online means. The most complex network structure above, in yellow, is that formed by the National Geographic magazine, its digital editions and the FoF project hub. Though the network is small, it is highly interconnected, allowing for exploration through the project’s storyworld.
Figure 4.3: Channel-story network overview
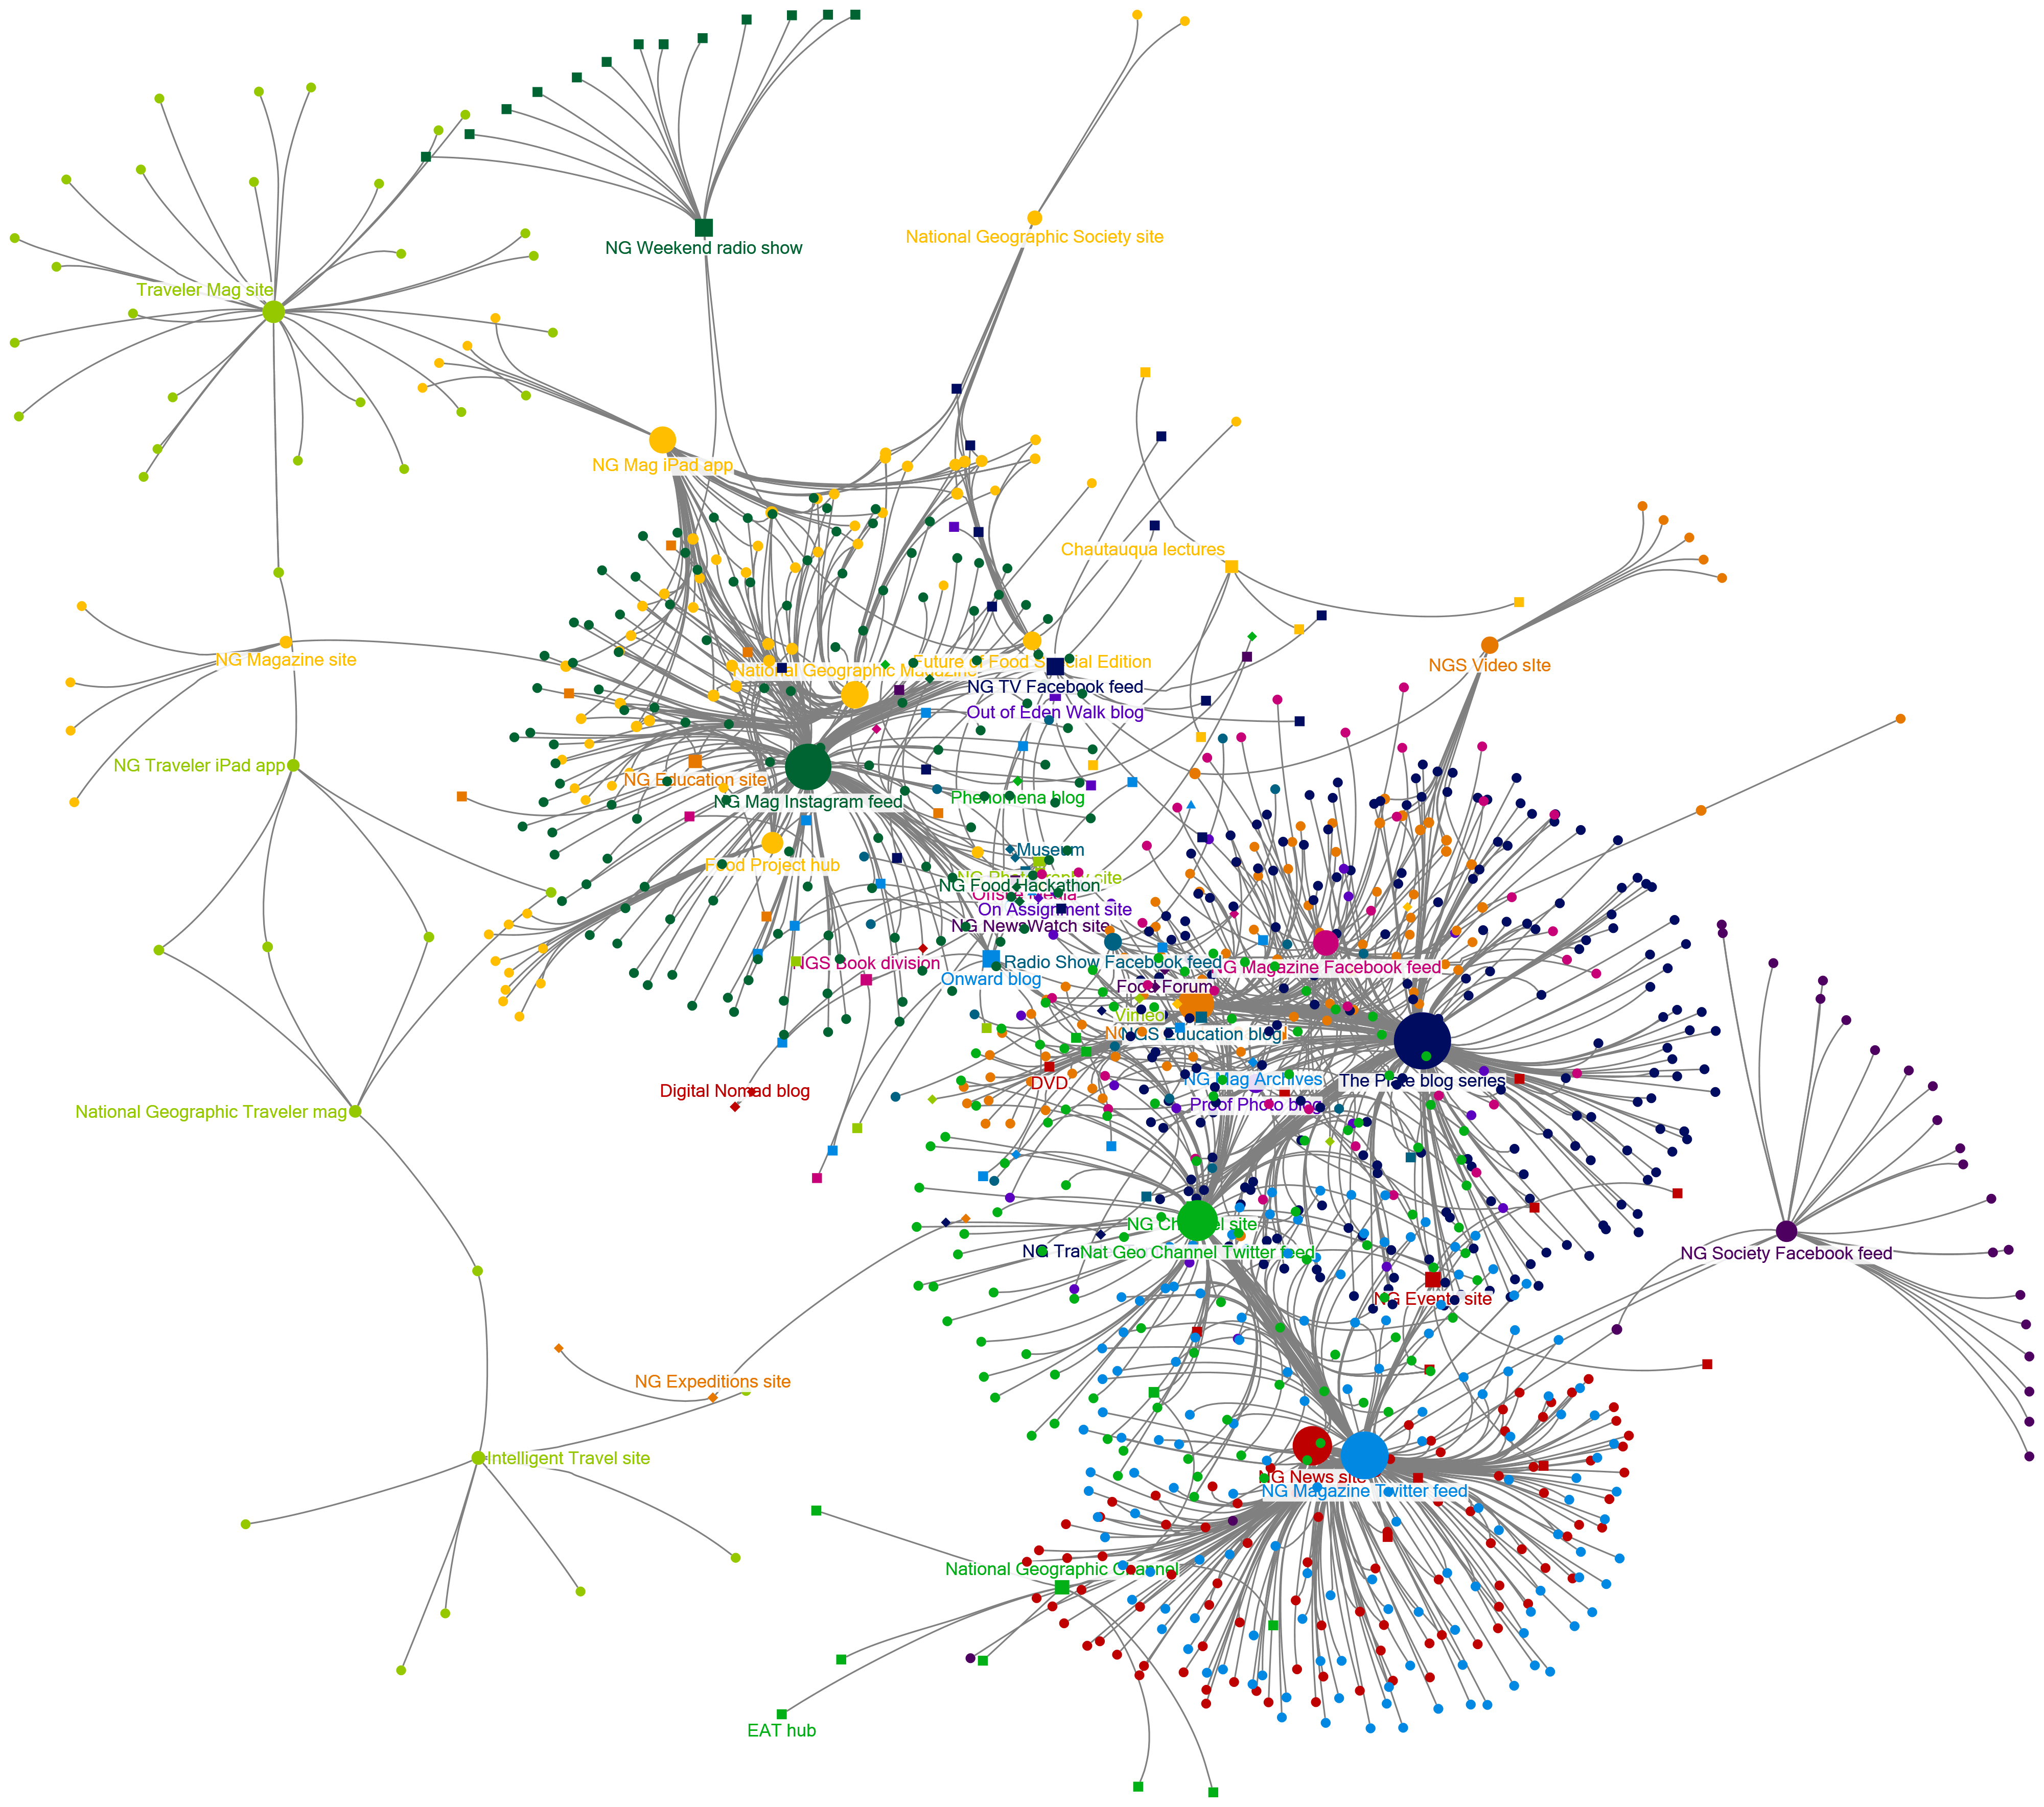
As it represents all 823 stories and 472 social media posts, the graph is very complex. But conspicuous here are the outlier subnetworks, positioned along the periphery by the algorithm for the lack of interrelation with other nodes. Nearer center are the more related and interconnected (central) subnetworks including The Plate, Instagram feed, the daily news service and the National Geographic magazine among others. Here two statistics regarding the size and structure of the network are illustrative. In the graph above the maximum geodesic distance — how many hops required to get from one connected node to the furthest possible node — is eight. The average geodesic distance is 2.99. Without a comparison to make with other transmedia projects studied with similar measures it is difficult to judge this statistic. However, for an engaged reader the average above does not seem daunting, and a worst-case scenario of eight is not impossible. The most difficult complication to exploration are nodes or subnetworks with few connections to the rest of the project.
Figure 4.4: Story links
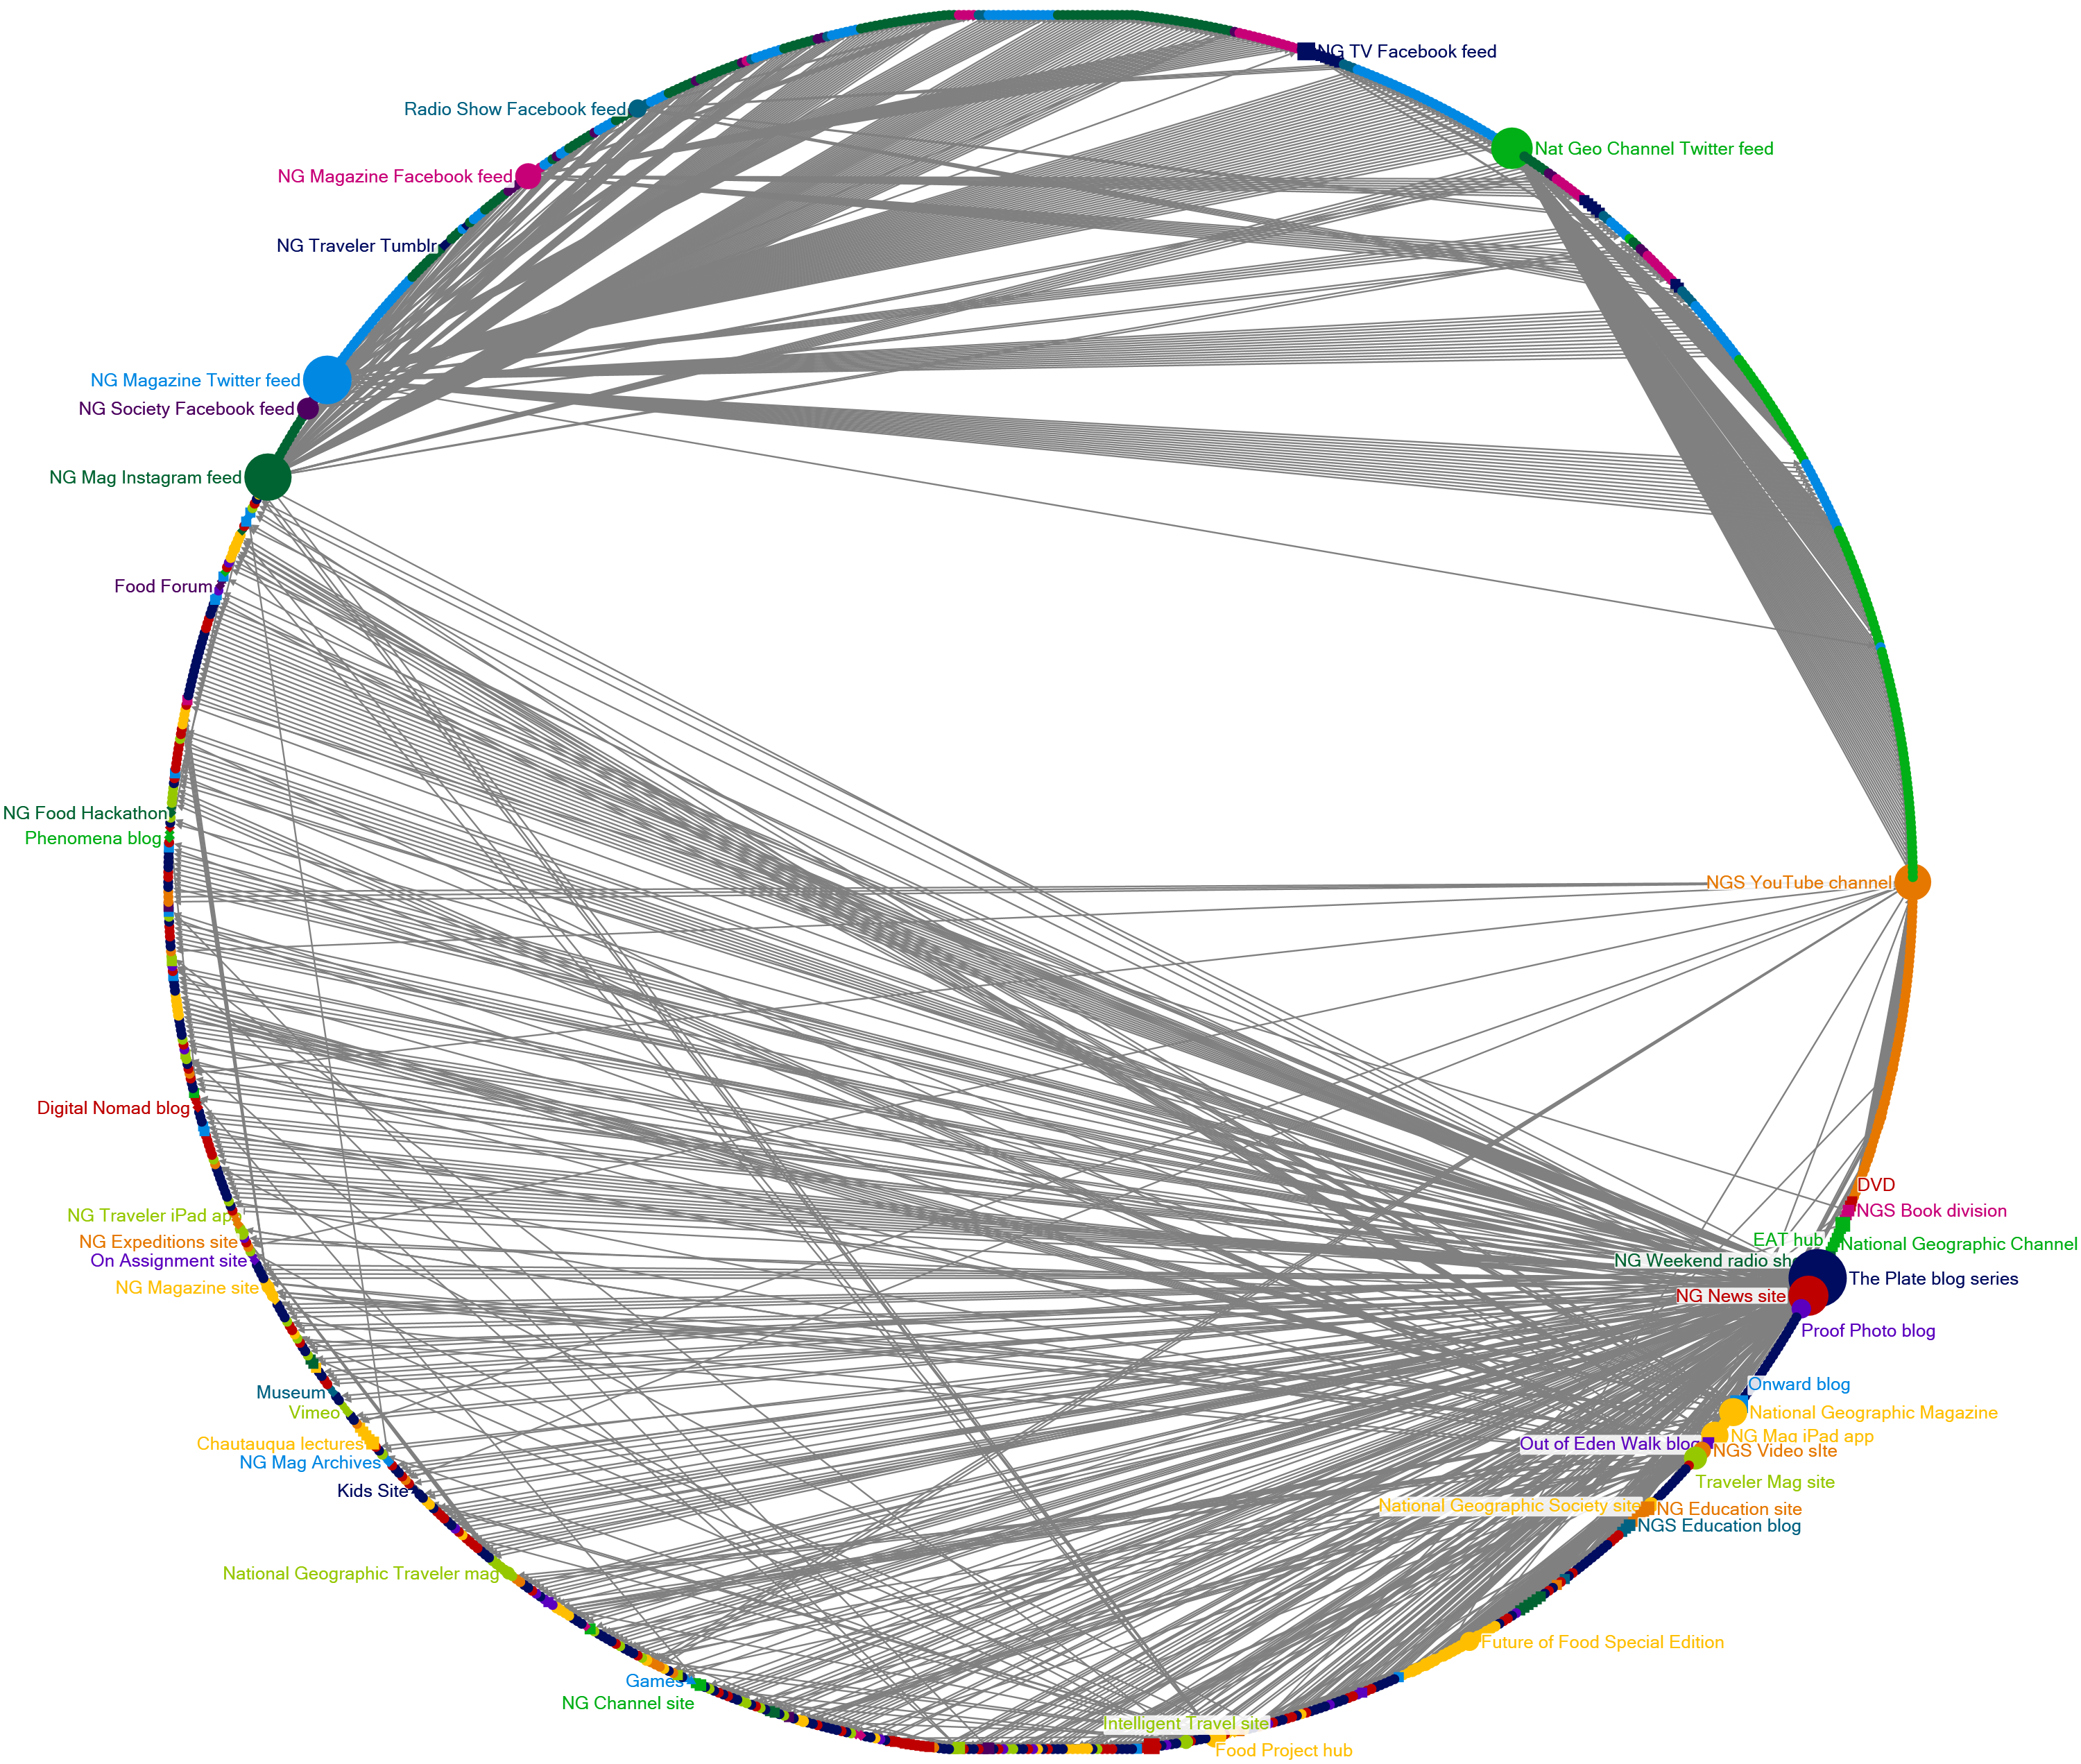
Not apparent in the graph due to its size and complexity is the direction of the connections. In most cases above the connections do not radiate outbound connections from a channel node, rather the connections converge into the large, highly central channel nodes. To rephrase, the stories connect to the channels and hubs far more often than the channels hubs connect out to stories.
Figure 4.5: External connections
This figure is interactive. Click on the image below and use the mouse to isolate the individual nodes and show their URLs.

The graph shows two hubs that have strong centrality among the internal and external link connections — the FoF project Web hub, in the lower right, and The Plate in the upper left. A third Web hub in the project, that for the “EAT: The Story of Food” miniseries, is dispersed on the lower left. The tightly organized and contained nodes surrounding the FoF hub contrast sharply with the complex structure surrounding The Plate. The origin of this difference is the conversational nature of the blog format. With the food hub at lower left we see exclusively inbound links coming from a high percentage of blue .org sites. These food- and sustainability-related organizations link to the project as a service for their publics. The links are inbound. In contrast, the similar-looking structure below the The Plate node in the graph — a tight crescent of nodes — are outbound links from The Plate to source material and related external content.


Leave a comment